R workshop - get started
Let’s learn R
Basic
RStudio projects and reproducibility with Quarto
Import, wrangle, and summarize data
Visualize — plus simple interactivity
Tidy data — plus pivoting and joining data frames
Regression — just a taste
An example of joining data and Exploratory Data Analysis
Advanced
Interactive visualization with ObservableJS
Custom functions
Iteration with {purrr}
Tidymodels
This is a Quarto website authored with R and the RStudio IDE. Quarto is part of your reproducible workflow and helps you render your analysis into various formats (PDF, Word, Website, Interactive, etc.)
First steps
- Tour of your Local File System
- R / RStudio
- Clone code from GitHub
- Start a new project by importing the github repository for this workshop
- Open the
import.qmdnotebook-file from the Files tab in the RStudio IDE
Download Project (data and code)
All data and code are readily available for this workshop.
Data
Whenever possible on-board datasets are used. Therefore, you may not have to load any data at all. For most of the data you only to load a library. For example the starwars dataset is part of the {dplyr} package — library(dplyr) to access the starwars data frame. Alternatively, you can access the data with the fully verbose package::function syntax — dplyr::starwars.
Some data sets are imported via the read_csv function and you can download the data and code from github (See GitHub icon; right-hand side of this webpage header), expand the zipped file. You’ll find a data folder with CSV files used in this workshop. Refer to the import page for tips on importing data.
Code
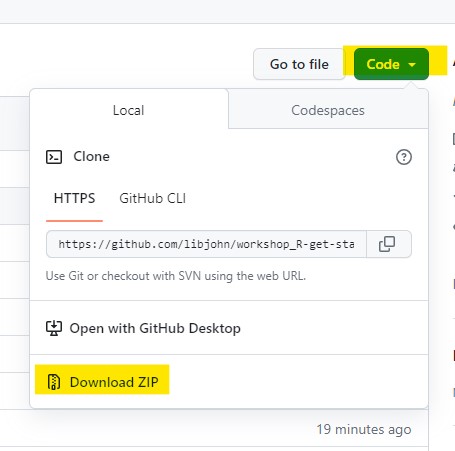
You can download the data and code from github (See GitHub icon; right-hand side of this webpage header), expand the zipped file. Double click the Intro2R.Rproj file to launch all of the code directly into an RStudio project.

Or
Use this link to the GitHub repo,
- Click the green code button
- Download ZIP
- Unzip and double click the
Intro2R.Rprojfile
Pipes and Assignment
Some coding syntax is unique in R and the Tidyverse. You will see these symbols frequently.
<- Assignment - “gets value from”
By convention we use two assignment symbols when creating object names
<-typically used at the beginning of a pipeline or function
=typically used within themutatefunction
Keystroke:
Alt-dash
Example:
my_vector <- c(2, 4, 6:9)
%>% Pipes and pipelines - “and then”
We can create data sentences, or pipelines, by chaining many functions together from left to right.
There are at least three main pipe symbols
|>or%>%
+only used in ggplot2 pipelines
Keystroke:
Ctrl-shift-M or Cmd-shift-M
Example:
cars |> select(speed)
More workshops
This workshop and many others covering topics in data science, visualization, mapping and GIS, and data management are hosted each semester by the Center for Data and Visualization Sciences (CDVS). All workshops are recorded with shareable code, data, slides and recordings. You can find the R-specific resources at our Rfun site. Meanwhile, all CDVS workshop materials are available at our online learning page — including duplicates of the R materials found at Rfun.

